The Gain and Pain of it All
Home Prices Accelerating:“Seattle area home-price gains keep accelerating” was the headline for the Seattle Times on Wednesday, December 29, 2015. But their most recent data was already history. They were reporting on information supplied to them by the NWMLS in which October was the most recent information available.A look behind the scenes, along with a look at the most recent data reveals this price trend is highly likely to continue and perhaps accelerate at an even faster rate as we emerge into the spring and summer months of 2016.Our data is compiled from a weekly statistical regimen that we maintain and that keeps us current right up to Monday morning of each week, when we again export the NWMLS data from 69 different NWMLS areas here in the Puget Sound area.Four charts are included below for your reference and a few simple interpretive notes are included below to help explain how to understand what the charts portray.
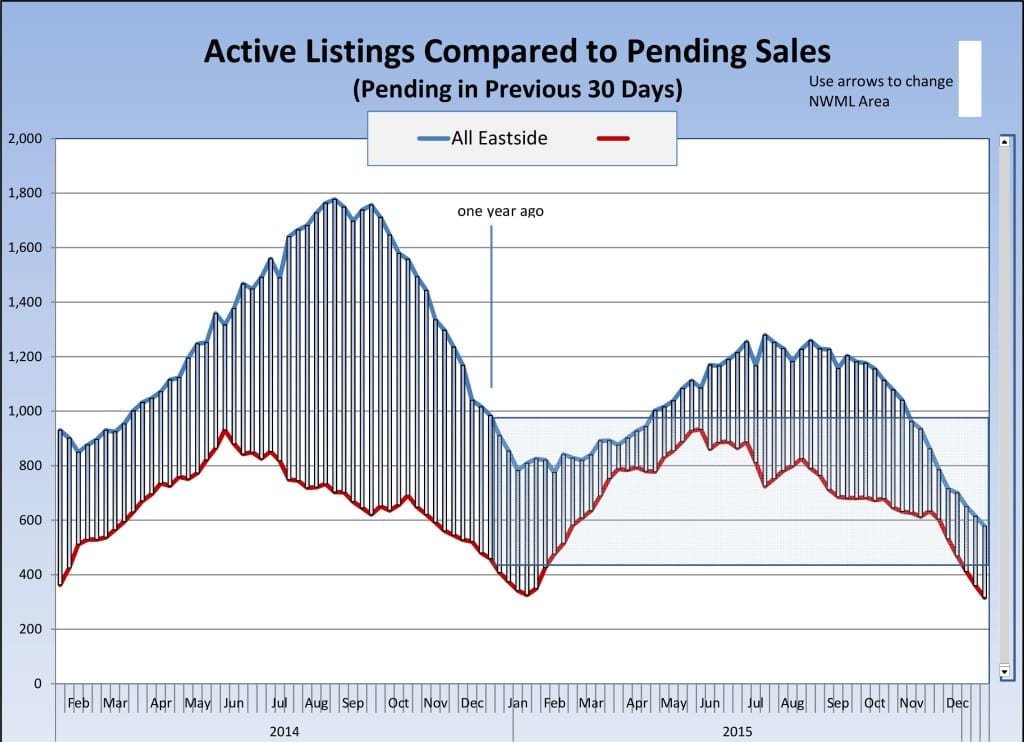
All of Eastside:
East Bellevue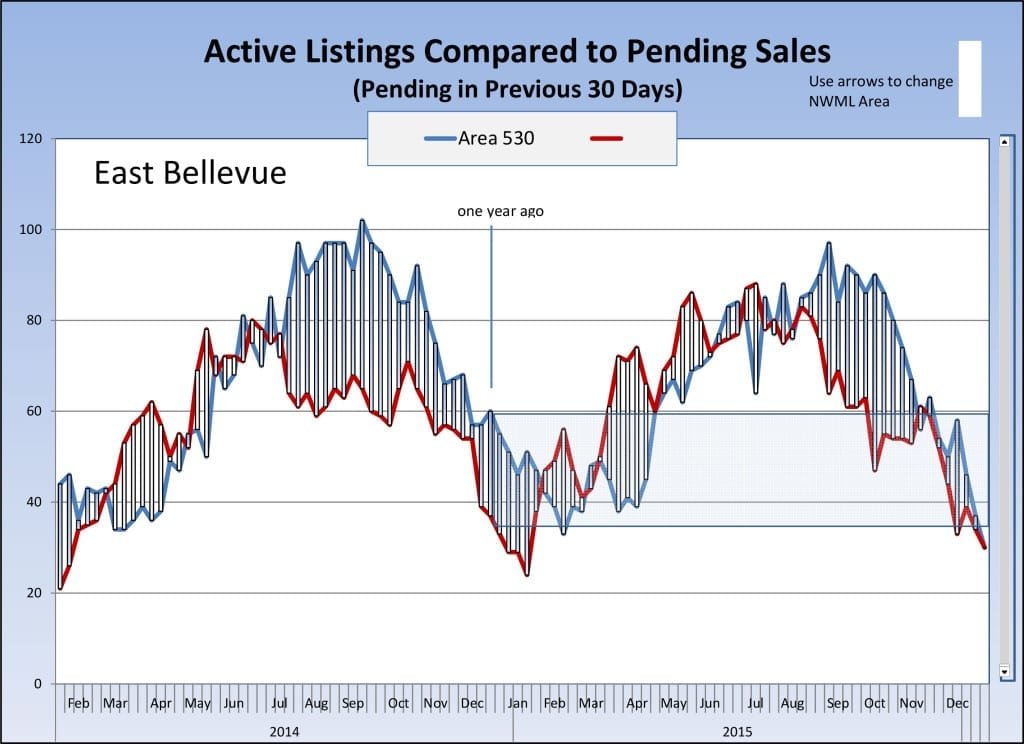 Ballard / Green Lake
 University / Lake City
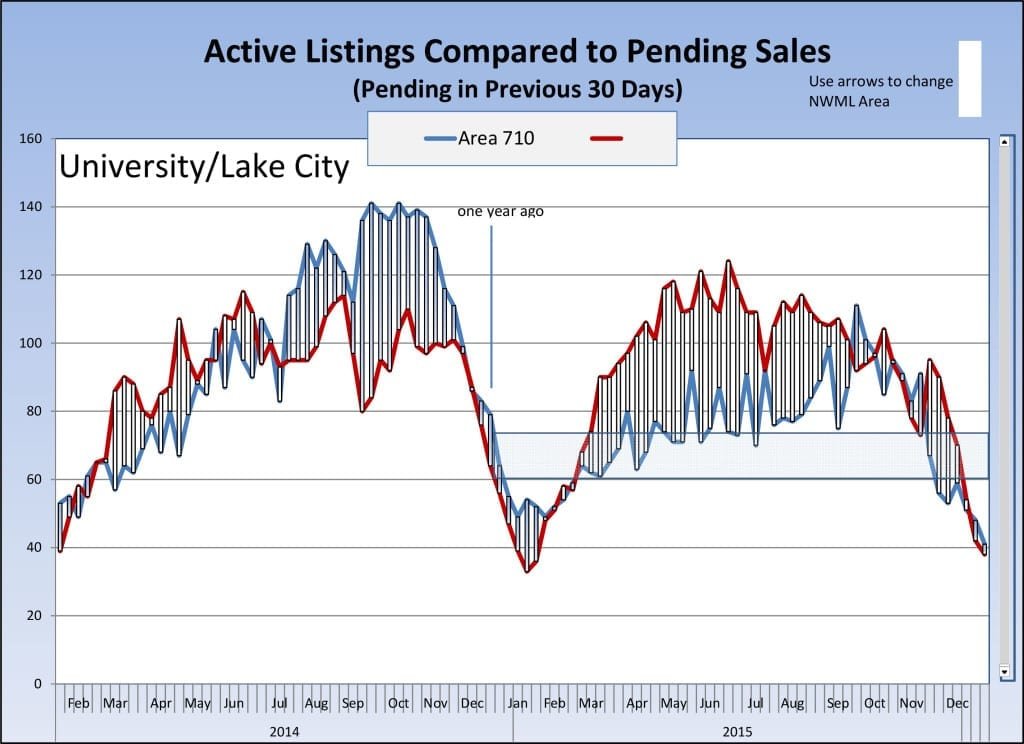
Interpretive Notes:The blue line in each chart signifies the number of homes that are listed and “Active” in the specific area shown for the weeks listed from left to right across the chart.The red line in each chart signifies the number of homes that entered into contract for sale (“Pending”) in the previous 30 days for each week shown.The vertical line in the approximate center of each chart shows the correlation of these two statistics just one year ago. The right margin of the chart reflects that same correlation for December 28, 2015.In Summary:Demand for housing has been overwhelming the supply of available homes for more than two years now, and it would appear that supply is going to be even weaker as we enter the new year, while demand will continue at nearly the same pace, or even increase.In each of the areas shown, there is less available housing at the end of 2015 than there was at the end of 2014, and yet the demand (red line) shows to be nearly the same now as it was at the end of 2014.Under-supply and over-demand has been a gain for sellers and a pain for buyers, and our crystal ball tells us that this will continue to be the case (especially) throughout the first half of 2016.Happy New Year to All!Bill Badgley